A SUMIFS formula that works correctly today can silently under-report totals tomorrow — with no error, no warning, and no visible sign that anything is wrong.
The cause is almost always the same: the formula references a fixed range that was large enough when the formula was written, but has since been outgrown by the data. New rows fall outside the range and are quietly excluded from every calculation that depends on it.
This post explains exactly how this happens, gives you three approaches that keep SUMIFS accurate as data grows, and shows you when to stop using SUMIFS altogether and switch to a Pivot Table.
How SUMIFS Silently Misses New Data
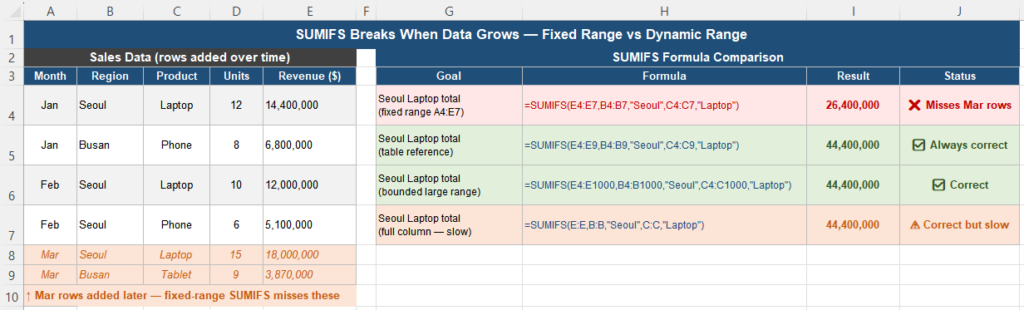
Consider a monthly sales report. In January, you write this formula to total revenue for the Seoul region:
=SUMIFS(E2:E100, B2:B100, "Seoul")At the time, the data runs from row 2 to row 87. The formula covers rows 2 to 100 — more than enough. It works perfectly.
Three months later, the dataset has grown to 340 rows. The formula still returns a result without any error. But it is now only summing the first 99 data rows. Everything from row 101 onward is silently excluded.
The number looks plausible. It is not dramatically wrong — just consistently lower than it should be by an amount that grows each month as more data falls outside the range. In a busy reporting cycle, this is easy to miss until someone checks the totals against another source.
Why Fixed Ranges Break as Data Grows
SUMIFS evaluates only the cells explicitly included in its range arguments. It has no knowledge of rows that exist outside those ranges. When you write E2:E100, Excel evaluates exactly those 99 cells — nothing more, regardless of how many rows of data the sheet contains.
There are three common ways this leads to wrong results:
1. The range was set too small at the start
The formula was written when the data had 80 rows and given a range of 100 — enough at the time, but with no buffer for future growth.
2. Data is appended below the range
New rows are added at the bottom of the sheet, as is standard practice. If those rows fall below the last row of the SUMIFS range, they are excluded immediately.
3. The formula is copied from an old report
A SUMIFS formula from a previous month’s file is copied into a new file without updating the range. The new file has more rows; the range still points to the old limit.
In all three cases, the formula runs successfully and returns a number. The number is wrong, but there is no signal to indicate this.
Three Approaches That Stay Accurate
Approach 1 — Excel Table references (best practice)
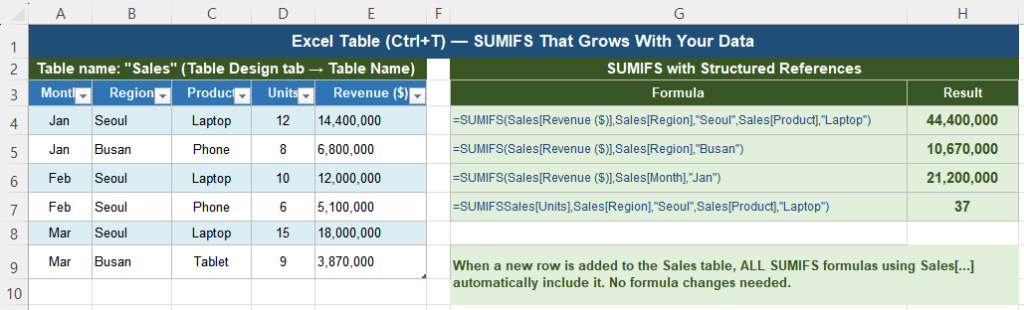
Converting your data range to an Excel Table with Ctrl + T and then referencing it by column name is the most robust solution. Table references automatically expand to include every row in the table — past, present, and future.
Fixed range (breaks as data grows):
=SUMIFS(E2:E100, B2:B100, "Seoul", C2:C100, "Laptop")Table reference (always accurate):
=SUMIFS(Sales[Revenue], Sales[Region], "Seoul", Sales[Product], "Laptop")When a new row is added to the Sales table, every SUMIFS formula using Sales[Revenue] automatically includes it. There are no range limits to outgrow and no formulas to update.
How to set up Excel Table references:
- Click any cell in your data range.
- Press Ctrl + T and confirm the range.
- In the Table Design tab, type a name for the table (for example,
Sales). - Update your SUMIFS formulas to use
Sales[ColumnName]syntax.
Approach 2 — Oversized bounded range with a large buffer
If converting to an Excel Table is not practical, use a bounded range large enough to cover years of expected growth:
=SUMIFS(E2:E100000, B2:B100000, "Seoul", C2:C100000, "Laptop")This is simpler than a table reference but requires a judgment call about how large to make the buffer. It is also slower than a table reference on large datasets because Excel evaluates all 99,999 rows regardless of how many contain data.
Approach 3 — Full column references as a last resort
Full column references like E:E never miss new data, but they come with a significant performance cost:
=SUMIFS(E:E, B:B, "Seoul", C:C, "Laptop")Excel scans all 1,048,576 rows in each referenced column. For a workbook with many SUMIFS formulas on large datasets, this can make the file noticeably slow. Use full column references only for small datasets or when performance is not a concern.
Handling OR Conditions in SUMIFS
Like COUNTIFS, SUMIFS uses AND logic between its condition pairs by default. If you need to sum rows where any one of several conditions is true, you need a different approach.
Wrong — returns 0 because no row can be both Seoul and Busan:
=SUMIFS(Sales[Revenue], Sales[Region], "Seoul", Sales[Region], "Busan")Correct — add two separate SUMIFS:
=SUMIFS(Sales[Revenue], Sales[Region], "Seoul") + SUMIFS(Sales[Revenue], Sales[Region], "Busan")Correct — SUMPRODUCT handles OR logic in one formula:
=SUMPRODUCT(((Sales[Region]="Seoul")+(Sales[Region]="Busan")>0) * Sales[Revenue])For a detailed guide to OR conditions with SUMIFS, see How to Calculate OR Conditions Correctly With SUMIFS.
When to Use a Pivot Table Instead
SUMIFS is the right tool when you need a specific total that feeds into another formula or updates automatically as data changes. It is the wrong tool when you need to summarize data across many category combinations or when the workbook slows down due to constant recalculation.
Pivot Tables recalculate only when you click Refresh — not on every cell change. For large datasets, this makes them dramatically faster than SUMIFS formulas that recalculate continuously.

Use a Pivot Table when:
- You need totals across many category combinations (region × product × month)
- The dataset has more than 50,000 rows
- The summary is shared with people who need to adjust filters themselves
- You do not need the total to feed into another formula
Use SUMIFS with table references when:
- The result feeds into another formula, chart, or dashboard cell
- You need the total to update automatically without a manual Refresh step
- The criteria are fixed and the number of conditions is manageable (five or fewer)
For more on Pivot Table limitations, see Why Pivot Tables Don’t Update After Refresh.
Comparison Table
| Feature | SUMIFS (fixed range) | SUMIFS (Table ref) | Pivot Table |
|---|---|---|---|
| Includes new rows automatically | No — misses rows beyond range | Yes — always | After Refresh only |
| Performance on large data | Moderate to slow | Fast | Fast |
| Result feeds into other formulas | Yes | Yes | Needs GETPIVOTDATA |
| OR condition support | Manual (add formulas) | Manual (add formulas) | Built-in filter |
| Updates automatically on data change | Yes | Yes | No — manual Refresh |
| Non-technical users can adjust | Hard | Hard | Easy — drag and drop |
| Best for | Small static datasets | Any growing dataset | Large multi-category summaries |
Quick Checklist
- SUMIFS with a fixed range silently excludes rows added beyond the range limit
- There is no error message — the formula returns a plausible but understated result
- Excel Table references (Sales[Revenue]) automatically include all current and future rows
- Converting to an Excel Table takes two minutes and permanently fixes the growing-data problem
- Oversized bounded ranges (E2:E100000) are a simpler but slower alternative
- Full column references (E:E) never miss data but are slow on large workbooks
- SUMIFS uses AND logic — for OR conditions, add separate SUMIFS results or use SUMPRODUCT
- Use a Pivot Table for large-dataset summaries across many categories
Frequently Asked Questions
Why is my SUMIFS returning a lower total than expected?
The most common cause is that new rows have been added below the bottom of the SUMIFS range. SUMIFS evaluates only the cells explicitly referenced — rows outside that range are silently excluded. Check whether your data now extends beyond the last row of your range arguments. Fix it by converting to an Excel Table and using structured references, or by extending the range to cover all current and future rows.
What is the safest way to write SUMIFS in a workbook where data grows?
Convert your data range to an Excel Table with Ctrl+T, give it a meaningful name (such as “Sales”), and reference columns by name in SUMIFS: =SUMIFS(Sales[Revenue], Sales[Region], “Seoul”). This approach automatically includes every row in the table — past, present, and future — without any formula changes when data is added.
Can I use full column references (E:E) in SUMIFS?
Yes, and they will always include all data regardless of how many rows exist. The trade-off is performance: full column references force Excel to scan over one million rows on every recalculation, even if your data occupies only a few hundred of them. For small to medium datasets this is acceptable. For workbooks with large data or many SUMIFS formulas, use Excel Table references or bounded ranges instead.
Why does SUMIFS return 0 when I try to sum for two regions?
SUMIFS applies AND logic between all conditions. A formula like =SUMIFS(Revenue, Region, “Seoul”, Region, “Busan”) asks for rows where Region is simultaneously “Seoul” AND “Busan” — which is impossible, so the result is always zero. For OR conditions, add two separate SUMIFS: =SUMIFS(Revenue, Region, “Seoul”) + SUMIFS(Revenue, Region, “Busan”).
Should I use SUMIFS or a Pivot Table for monthly reporting?
It depends on how the results are used. If the monthly totals feed into a dashboard, chart, or other formula that needs to update automatically, use SUMIFS with Excel Table references. If the monthly report is a standalone summary that people browse and filter, a Pivot Table is faster to build and easier to adjust. Many reports use both: a Pivot Table for exploration and SUMIFS formulas for specific KPI cells in a dashboard.