Open ten different Excel files from ten different teams, and the layouts will all look different. The formulas will not. The same small set of functions appears again and again, despite Excel offering several hundred to choose from.
This is not a coincidence, and it is not a lack of curiosity among Excel users. Real office work creates a specific, narrow set of demands, and only functions that satisfy those demands survive repeated use across teams and years. Understanding why these functions dominate tells you more about building reliable workbooks than memorizing a long function list ever would.
This post breaks down the five roles that core functions fill, walks through a full monthly-report scenario where all five appear together, and gives you a practical reference for which functions belong in which layer of a workbook.
Why the Same Functions Keep Appearing
Excel has hundreds of built-in functions, covering everything from financial modeling to engineering calculations to statistical analysis. Yet the formulas that show up in everyday business workbooks — sales trackers, HR reports, finance summaries — draw from a surprisingly small pool.
This is not because most Excel users are unaware of advanced functions. It is because real office work creates the same handful of needs over and over: summarizing numbers, matching records across tables, cleaning messy imports, handling missing data gracefully, and aligning results to calendar periods. Functions that solve these needs reliably get reused. Functions that do not, however clever, fade out of regular use.
Four Reasons Office Work Narrows the Function Set
1. Office work is repetitive, not experimental
Most spreadsheet work in a business setting revolves around the same operations performed on different data each month: summarize this, match that, clean this column, handle missing values here. Functions that solve these recurring problems reliably get reused across every new report.
2. Stability matters more than cleverness in shared workbooks
A formula that one person understands but nobody else can maintain becomes a liability the moment that person leaves or moves to another project. Functions that behave predictably and fail visibly — rather than cleverly but obscurely — survive handovers between team members.
3. Reports evolve and data grows over time
A workbook built once and reused monthly accumulates more rows, new categories, and structural changes. Manual steps and fixed-range formulas break under this growth. Only functions and patterns that scale with growing data remain usable long-term.
4. Excel rewards functions that compose well with others
Functions that return clean values, accept clean inputs, and separate logic from presentation naturally combine into longer formulas without breaking. This composability is why TRIM, VALUE, IFERROR, and lookup functions appear nested inside each other constantly — they were designed to work as building blocks.
The Five Roles Core Functions Fill
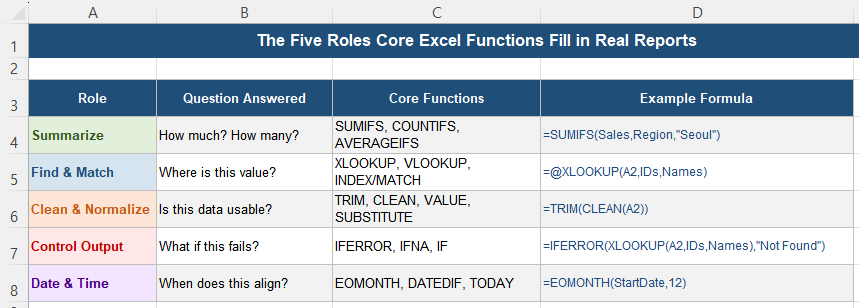
Role 1 — Summarize: “How much? How many?”
SUMIFS and COUNTIFS answer the most common reporting questions: totals and counts under specific conditions. They work directly on raw data, are easy to audit by inspection, and scale automatically as rows increase — three properties that make them nearly unavoidable in any reporting workbook.
Role 2 — Find and Match: “Where is this value?”
XLOOKUP, VLOOKUP, and INDEX/MATCH pull values from one table into another — connecting an ID to a name, a code to a price, a record to its category. Source data is rarely perfect, so these functions are almost always paired with error handling, since missing matches are a normal, expected condition rather than an edge case.
Role 3 — Clean and Normalize: “Is this data usable?”
TRIM, CLEAN, VALUE, and SUBSTITUTE rarely appear in a final report’s visible cells, but they are doing critical work in helper columns behind the scenes. Without them, lookups fail on hidden characters, duplicates multiply from formatting differences, and totals quietly drift from text-typed numbers.
Role 4 — Control Output and Errors: “What happens if this fails?”
IFERROR, IFNA, and IF do not change what a calculation produces — they change how failure is displayed to the people reading the report. A manager should never see #N/A in a finished dashboard; these functions exist specifically to make that true.
Role 5 — Date and Time: “When does this align?”
EOMONTH, DATEDIF, and TODAY appear constantly in HR, finance, and operations files because business runs on calendars — fiscal months, contract durations, reporting periods. These functions align raw dates to the calendar structures a business actually reports against.
Full Scenario: A Monthly Report
Consider a monthly sales report that pulls raw data from a source sheet, cleans inconsistent inputs, calculates totals and dates, and prepares a summary for managers. Walking through it shows all five roles working together in sequence.
Raw data arrives with problems: extra spaces around region names, sales figures stored as text with trailing line breaks, and dates that need to align to month-end for reporting.
Step 1 — Clean (Role 3):
=TRIM(CLEAN(B2))          ← removes spaces and line breaks from Region
=VALUE(TRIM(C2))          ← converts text-formatted sales figures to numbers
Step 2 — Summarize (Role 1):
=SUMIFS(CleanSales, CleanRegion, "Seoul")Step 3 — Find and Match (Role 2):
=XLOOKUP("R-001", RepIDs, RepNames)Step 4 — Control Output (Role 4):
=IFERROR(XLOOKUP("R-999", RepIDs, RepNames), "Not Found")Step 5 — Date Alignment (Role 5):
=EOMONTH(SaleDate, 0) ← aligns each transaction to its reporting month-end
Building Workbooks in Four Layers
Mapping the five roles onto workbook structure produces a consistent four-layer pattern across stable, reusable reports:
| Layer | Name | Typical Functions |
|---|---|---|
| 1 | Raw Data (untouched) | None — source data only |
| 2 | Cleaning and Normalization | TRIM, CLEAN, VALUE, SUBSTITUTE |
| 3 | Core Calculations | SUMIFS, COUNTIFS, XLOOKUP, EOMONTH, DATEDIF |
| 4 | Presentation and Error Handling | IFERROR, IFNA, number formatting |
Most of the functions people think of as “the top Excel functions” naturally cluster into layers 2 and 3. This is not a coincidence — these are exactly the layers where repetitive, scalable, well-defined problems live.
The Practical Top 10
| # | Function | Role | Why it survives |
|---|---|---|---|
| 1 | SUMIFS | Summarize | Scales with data, easy to audit |
| 2 | COUNTIFS | Summarize | Same logic as SUMIFS, widely understood |
| 3 | XLOOKUP / VLOOKUP | Find & Match | Universal need to pull values across tables |
| 4 | INDEX/MATCH | Find & Match | Survives column reordering |
| 5 | TRIM | Clean | Fixes the most common hidden-character problem |
| 6 | SUBSTITUTE | Clean | Removes known unwanted characters reliably |
| 7 | IFERROR | Control Output | Prevents error propagation in finished reports |
| 8 | IF | Control Output | Basic branching — the foundation of conditional logic |
| 9 | EOMONTH | Date & Time | Calendar-aligned reporting periods |
| 10 | DATEDIF | Date & Time | Duration calculations for HR and finance |
Why Rare Functions Don’t Survive
Advanced or niche functions often look impressive in a demonstration, but in production workbooks they tend to break more easily under real-world data variation and confuse the colleagues who inherit the file later. Widely used core functions, by contrast, are understood by most people who will ever open the workbook, are easier to maintain across personnel changes, and survive handovers without requiring documentation just to be read.
This does not mean advanced functions are never appropriate — FILTER and UNIQUE, for example, solve real recurring problems and are becoming core functions in their own right. The distinction is between functions that solve a genuine recurring need versus functions chosen primarily to demonstrate technical skill.
Quick Checklist
- The same small set of functions dominates real workbooks because office work creates the same recurring needs everywhere
- Five roles cover most real-world needs: summarize, find and match, clean, control output, and date alignment
- SUMIFS and COUNTIFS dominate the summarize role; XLOOKUP and INDEX/MATCH dominate find and match
- TRIM, CLEAN, and VALUE rarely appear in final cells but are essential in helper columns
- IFERROR and IFNA control how failures are displayed, not how calculations work
- EOMONTH and DATEDIF align raw dates to the calendar structures businesses actually report against
- Centralize core logic once per workbook rather than repeating it across many formulas
- Ask “what role does this formula perform” rather than “what is the rarest function I can use”
Frequently Asked Questions
Why do the same Excel functions appear in almost every workbook?
Real office work creates a narrow, repeating set of needs: summarizing totals, matching records across tables, cleaning imported data, handling missing values gracefully, and aligning dates to reporting periods. Functions that solve these problems reliably and predictably get reused across every new report. Functions that solve rarer or more specialized problems naturally appear less often, regardless of how capable they are.
What are the most important Excel functions to learn first?
Focus on covering five roles rather than memorizing a fixed list: SUMIFS and COUNTIFS for summarizing data, XLOOKUP or VLOOKUP for finding and matching values across tables, TRIM and SUBSTITUTE for cleaning imported data, IFERROR for controlling how failures display, and EOMONTH or DATEDIF for date and duration calculations. Together, these cover the vast majority of real-world reporting needs.
Is it better to use advanced functions or stick to common ones?
It depends on whether the advanced function solves a genuine recurring need or is chosen mainly to demonstrate skill. Functions like FILTER and UNIQUE solve real, common problems and are increasingly considered core tools. Functions chosen purely for their complexity tend to break more easily on edge cases and are harder for colleagues to maintain. In shared workbooks, predictable and well-understood functions are usually the better long-term choice.
Why do cleaning functions like TRIM matter if they’re rarely visible in the final report?
Cleaning functions operate in helper columns behind the scenes, preparing raw data so that the visible calculations work correctly. Without them, lookups fail due to hidden characters, duplicates multiply because of formatting inconsistencies, and totals quietly drift from numbers stored as text. Their invisibility in the final report is exactly the point — they prevent the kinds of silent errors that would otherwise surface in the visible calculations.
How should I structure a workbook to use these core functions effectively?
Use a four-layer structure: keep raw data untouched in layer 1, apply cleaning functions like TRIM and VALUE in layer 2, perform core calculations like SUMIFS and XLOOKUP in layer 3, and apply presentation and error handling like IFERROR only in layer 4. This separation means each function operates on already-reliable input, which is what allows these core functions to scale and remain maintainable as the workbook grows.